
Measuring Statistical Significance in Marketing and Why It’s Important
Reading Time: 8 minutesAuthor:
For business owners, measuring statistical significance in marketing is crucial. It helps marketers make decisions by using reliable, accurate data.
This article will explore statistical significance in marketing, why it matters, and how marketers can measure statistical significance to improve their marketing efforts. We will cover the steps required to set up a valid A/B split test, how to measure the statistical significance of the results (click the link to jump to the calculator), and discuss why it’s important. And we will touch on the wonky bits, but don’t worry, while we’ll highlight why something is important, we won’t get too far into the weeds.
What is Statistical Significance in Marketing?
Statistical significance is a term that’s often talked about, but not everyone understands what it means or why it’s important. In simple terms, statistical significance refers to whether the results of an experiment or study are due to chance or are actually meaningful. This is important because if the results are insignificant, the marketer cannot be confident that what’s shown in the test will lead to the desired outcome. To determine whether a result is statistically significant, a marketer will usually perform a statistical test, which will take into account the sample size, the variability of the data, and the confidence level desired.
Why is Statistical Significance in Marketing Important?


Get Digital Tips & Tricks Delivered to Your Inbox
Statistical significance is important in marketing because it helps marketers make decisions based on reliable and accurate data that’s likely repeatable. By understanding whether test results are statistically significant or not, marketers can determine whether the change being tested will have a real impact on campaign performance.
For example, if a marketer is testing two offers and one performs better than the other, they’d go with the better result, right? Maybe. Measuring statistical significance will tell you whether the improvement was the result of the change being tested or happenstance. Statistical significance lets a marketer have confidence in the results.
Common Mistakes in Statistical Analysis
Some of the key factors to consider include sample size, variability of the data, and the level of confidence desired.
Sample Size
A small sample size is the most common error. When marketers calculate statistical significance, larger sample sizes are more likely to produce reliable results when testing an alternative hypothesis. This is because larger samples reduce the impact of random variation, increasing the results’ accuracy.
Confounding Variables
Another common mistake in statistical analysis is not properly controlling for confounding variables. (What? You don’t daydream about confounding variables?) For example, if a marketer is testing two different subject lines, they should ensure that other variables, such as gender, age, location, and income level, the confounding variables, are the same across both groups. If these variables differ between the two groups, it can skew the results and lead to an inaccurate conclusion. Additionally, as mentioned above, it’s important to ensure the sample group is large enough so that random variations don’t affect the results.
Confidence Interval
Finally, if a marketer wants to be confident in their results, they should ensure that the confidence interval for their chosen test has been set at an appropriate level (e.g., 95%). Confidence intervals are a range of values that are likely to contain the true value of a population parameter (such as a mean or a proportion). Marketers can assess the validity of their results by considering the confidence interval.
For example, a marketer can have more confidence in statistically significant results using a 95% confidence interval than the results using an 80% confidence interval. Failing to consider confidence intervals can lead to false positives or false negatives, which can have disastrous consequences.
Practical significance
Practical significance refers to the real-world significance of a result. In other words, even if a result is statistically significant, it may not be practically significant if the impact is small. For example, a 1% increase in sales may be significant, but it may not be enough to justify the cost of the marketing campaign. Don’t test things you can’t afford to do.
Confirmation testing is also wise. If the results of a small test are statistically significant, and it’s something you can afford to scale, then it’s smart to run a confirmation test using a larger sample to ensure the results can be replicated and aren’t the result of some other factor.
Statistical Significance Calculator
I’m not going to get into the math here. I’m not competent to do this, and I don’t want to bore you into leaving. If you’re uncomfortable assessing statistical significance yourself, you can use the calculator below to run statistical significance tests.
Measure Statistical Significance in Marketing Campaigns
Significant result!
Variant B’s conversion rate (5.20)% was higher than variant A’s conversion rate (4.33)%. You can be 95% confident that variant B will perform better than variant A.
p value
0.0082

Measuring Significance – the Wonky Stuff
As I promised, this isn’t a math tutorial. We will highlight the key things to consider when you calculate statistical significance. Specifically, the two most important concepts to understand are the P value and confidence intervals. While mostly not math, understanding the difference between correlation (math) and causation (not math) is also important.
P Value
The P value measures how likely it is that the differences between your variations were caused by random chance. For example, a low P value (less than 0.05) indicates that the difference is unlikely to be random chance, and therefore the result is likely statistically significant. A high P value suggests that the significance level is low.
Confidence Intervals
The confidence interval measures how confident you can be that the result is accurate and will be consistent across multiple testing cycles. This was mentioned above, but it’s worth repeating. Having three confidence levels is typical: 90%, 95%, and 99%. Select 95% most of the time. 90% is a bit loose, and 99% is too tight. Use them to give you a better sense of how the test performed.
Correlation vs. Causation
The notion of correlation pertains to a statistical affiliation between two variables, whereas causation refers to a direct influence that one variable has over the other. Marketers must understand the distinction between correlation and causation to avert erroneous presumptions regarding their data.
Consider the correlation between the consumption of ice cream and the incidence of sunburn. There is a positive correlation between the two variables, meaning that as ice cream consumption increases, so does the incidence of sunburn. However, it is important to note that this does not necessarily mean that ice cream consumption directly causes sunburn.
In this case, a third variable is at play: exposure to the sun. As people spend more time outside in warmer weather, they are more likely to both eat ice cream and get sunburned. Therefore, while there is a correlation between the two variables, ice cream consumption does not directly cause sunburn.
This simple example highlights the importance of understanding the distinction between correlation and causation in data analysis. It is vital to examine all possible factors that may be influencing the relationship between variables before making any conclusions about cause and effect.
A/B Testing for Marketers – A Practical Application of Statistical Significance in Marketing
A/B Testing
A/B split testing is a common method used in marketing to test an alternative hypothesis (such as two different landing pages, or two different email subject lines, or two offers) and determine which one is more effective. A/B split testing compares different versions of ad campaigns, headlines, or the offer conversion rate to determine which performs better. A marketer calculates the statistical significance of the resulting change to determine whether or not the results of the test are significant.
Setting Up a Test
As with most things, a successful outcome depends on planning. It’s essential to clearly understand the alternative hypothesis you are trying to understand with the test and, therefore, which metrics will be measured.

Be sure to test big things. Trying to increase the conversion rate or the click-through rate is a big thing. Blue versus red isn’t. And assess your assumptions. See the bit above about the difference between correlation and causation.
Once you have identified the goal, decide which metric will be used to measure success. This could be conversion rate, click-through rate, page views per session, or any other metric that helps you track progress toward your goal.
It’s important to isolate the changes you are testing so if your test results are statistically significant, you know exactly what caused the difference. If you change more than one thing in a test cell, you won’t know which change caused the result.
Finally, be sure that the hypothesis you are testing can scale. Having a successful test that you cannot afford to implement is not a good use of time and budget.
A/B Split Testing Best Practices
When it comes to A/B testing, there are a few best practices that you should keep in mind.
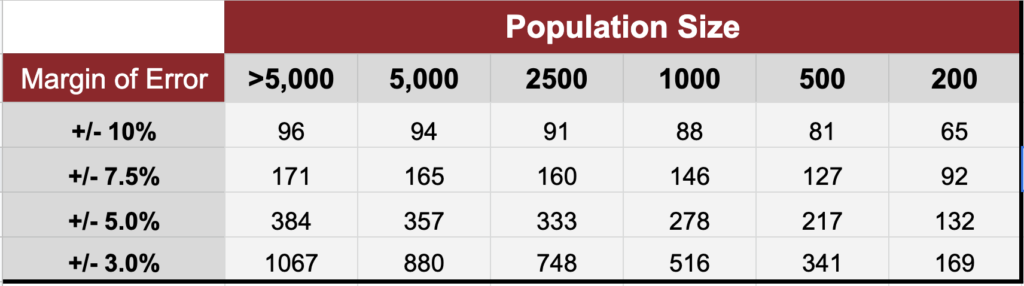
First and foremost, you should consider your sample size and the minimum detectable effect. Small sample sizes lead to low-confidence results. It is important that your sample size is large enough to detect changes in conversion rates or other metrics of interest but isn’t too large, which is a waste of resources.
There are tools available to determine minimum sample sizes. Generally, you need at least 100 in the test cell. A good rule of thumb is 10% of the population up to one thousand. You can use the chart below as a guide.
By understanding the key concepts and principles behind A/B testing and statistical significance and by following best practices, marketers can confidently analyze data from testing and make data-driven decisions.
Plan on Multiple Tests
Please don’t think that testing is complete after a single test.
It’s best practice to re-run the same test (confirmation testing) multiple times to increase your confidence in the result. The initial result might be an outlier, or external factors may have influenced the results. Things as simple as changes in the weather, the time period, or changes in customer preferences over time can influence the results.
It’s also a good idea to gradually increase the size of the test cells each time you run a confirmation test.
You need to do both things to ensure that you make the best decisions for your business.
Interpreting Results
Once an A/B test is complete, it’s time to interpret the results.
If the change is statistically significant, you can be confident that the winning variation will perform better than the control. But, as mentioned above, don’t rely too much on the results from a single test. This can lead to marketing mistakes. New Coke, anyone?
You should always run your tests multiple times with gradually increasing sample sizes and measure statistical significance each time. You want to understand the data’s overall trend before making decisions.
Finally, don’t rely solely on a tool to provide the answer; consider your own interpretation as well.
A/B Testing for Marketers
You can confidently make data-driven decisions using A/B split testing and assessing the results for statistical significance. Conduct the analysis, measure statistical significance, and add your own interpretation.
Conclusion – Statistical Significance in Marketing is Empowerment Juice
Assessing the validity of results is crucial for marketers who are trying to improve their marketing efforts using A/B split tests. Assessing statistical significance ensures that results are reliable and repeatable and will accurately predict results when rolled out.
Good luck and happy testing!
Measuring Statistical Significance – FAQs
Statistical significance is important in marketing because it helps marketers make data-driven decisions about ad campaigns.
Correlation is a statistical relationship between two variables, while causation is a relationship where one variable directly influences the other.
Marketers can use statistical tests to measure the significance of observed changes in A/B split tests. This allows them to confidently make data-driven decisions, ensuring that marketing investments will result in a positive return.
Related Posts
-
Add Power Steering to Your Marketing
Learn how UTM codes turn hunches into confidence.
-
Marketing Math and Dashboards
Seven marketing math concepts that turn dashboards from decoration into growth decision engines.
-
The 6 Marketing Measurement Mistakes
The businesses that win will embrace marketing measurement to compound their wins. Six mistakes to avoid to be one of them.
Author: James Hipkin
Since 2010, James Hipkin has built his clients’ businesses with digital marketing. Today, James is passionate about websites and helping the rest of us understand online marketing. His customers value his jargon-free, common-sense approach. “James explains the ins and outs of digital marketing in ways that make sense.”
Use this link to book a meeting time with James.